
非官方中文翻译
本页译自 MNE-Python 官方文档:
查看英文原文 ↗。
文档版权归 MNE Developers 所有(BSD-3-Clause)。
说明
转到末尾下载完整示例代码。
通过回归减少 EOG 伪迹#
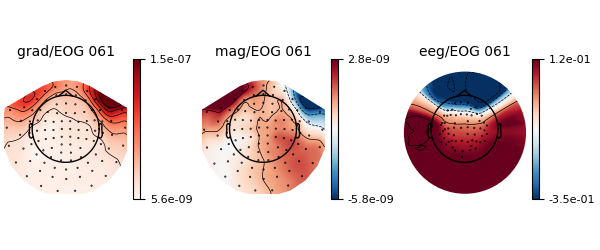
通过把 EOG 通道回归到其余通道上,再减去 EOG 信号来减少伪迹。
这是一个快速示例,展示该技术最基本的用法。更深入的说明与更高级的方法请参阅教程。
# Author: Marijn van Vliet <w.m.vanvliet@gmail.com>
#
# License: BSD-3-Clause
# Copyright the MNE-Python contributors.
导入包并加载数据#
照例先导入必要的 Python 模块并加载数据,这里是 MNE 示例数据集。
from matplotlib import pyplot as plt

import mne
from mne.datasets import sample
from mne.preprocessing import EOGRegression

print(__doc__)

data_path = sample.data_path()
raw_fname = data_path / "MEG" / "sample" / "sample_audvis_filt-0-40_raw.fif"

# Read raw data
raw = mne.io.read_raw_fif(raw_fname, preload=True)
events = mne.find_events(raw, "STI 014")

# Highpass filter to eliminate slow drifts
raw.filter(0.3, None, picks="all")
Opening raw data file /home/circleci/mne_data/MNE-sample-data/MEG/sample/sample_audvis_filt-0-40_raw.fif...
    Read a total of 4 projection items:
        PCA-v1 (1 x 10²)  idle
        PCA-v2 (1 x 10²)  idle
        PCA-v3 (1 x 10²)  idle
        Average EEG reference (1 x 60)  idle
    Range : 6450 ... 48149 =     42.956 ...   320.665 secs
Ready.
Reading 0 ... 41699  =      0.000 ...   277.709 secs...
Finding events on: STI 014
319 events found on stim channel STI 014
Event IDs: [ 1  2  3  4  5 32]
Filtering raw data in 1 contiguous segment
Setting up high-pass filter at 0.3 Hz

FIR filter parameters
---------------------
Designing a one-pass, zero-phase, non-causal highpass filter:
- Windowed time-domain design (firwin) method
- Hamming window with 0.0194 passband ripple and 53 dB stopband attenuation
- Lower passband edge: 0.30
- Lower transition bandwidth: 0.30 Hz (-6 dB cutoff frequency: 0.15 Hz)
- Filter length: 1653 samples (11.009 s)
执行回归并去除 EOG#
# Fit the regression model
weights = EOGRegression().fit(raw)
raw_clean = weights.apply(raw, copy=True)

# Show the filter weights in a topomap
weights.plot()
Created an SSP operator (subspace dimension = 4)
4 projection items activated
SSP projectors applied...
处理前后对比#
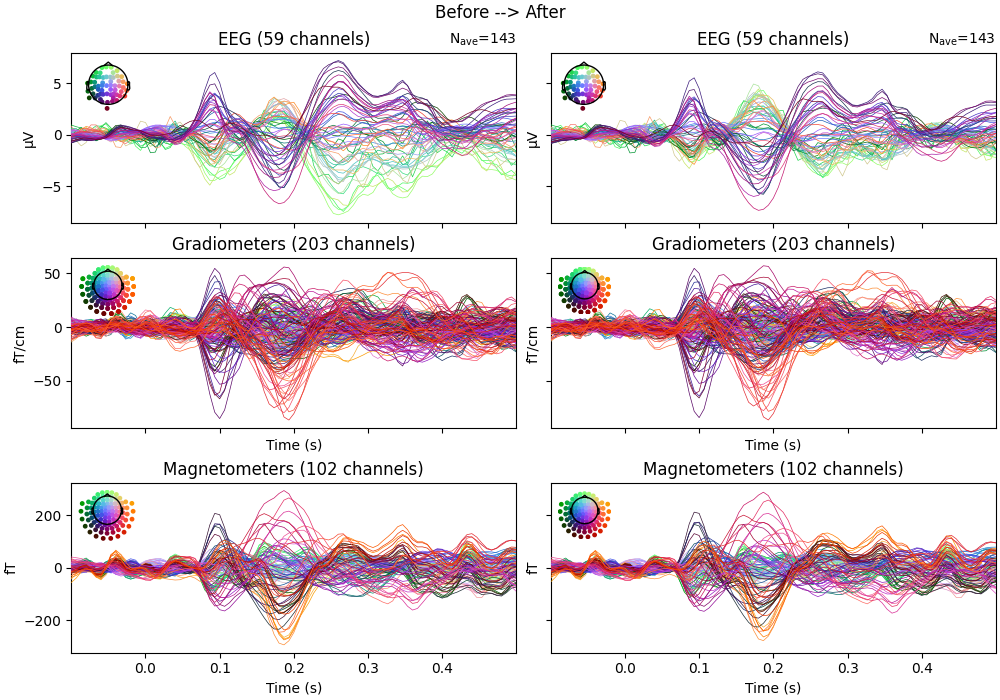
比较 EOG 回归清理前后的信号,最好通过提取分段并绘制诱发电位来观察。
tmin, tmax = -0.1, 0.5
event_id = {"visual/left": 3, "visual/right": 4}
evoked_before = mne.Epochs(
    raw, events, event_id, tmin, tmax, baseline=(tmin, 0)
).average()
evoked_after = mne.Epochs(
    raw_clean, events, event_id, tmin, tmax, baseline=(tmin, 0)
).average()

# Create epochs after EOG correction
epochs_after = mne.Epochs(raw_clean, events, event_id, tmin, tmax, baseline=(tmin, 0))
evoked_after = epochs_after.average()

fig, ax = plt.subplots(
    nrows=3, ncols=2, figsize=(10, 7), sharex=True, sharey="row", layout="constrained"
)
evoked_before.plot(axes=ax[:, 0], spatial_colors=True)
evoked_after.plot(axes=ax[:, 1], spatial_colors=True)
fig.suptitle("Before --> After")
Not setting metadata
143 matching events found
Applying baseline correction (mode: mean)
Created an SSP operator (subspace dimension = 4)
4 projection items activated
Not setting metadata
143 matching events found
Applying baseline correction (mode: mean)
Created an SSP operator (subspace dimension = 4)
4 projection items activated
Not setting metadata
143 matching events found
Applying baseline correction (mode: mean)
Created an SSP operator (subspace dimension = 4)
4 projection items activated
脚本总运行时间:(0 分 3.329 秒)