
说明
转到末尾下载完整示例代码。
连续数据的频谱-时间感受野(STRF)估计#
本示例演示如何用多个连续输入来拟合编码模型。在这里,我们模拟频谱-时间感受野(STRF)背后的模型。首先,我们创建一个线性滤波器,将频谱-时间空间中的模式映射为表示神经活动的输出。然后,我们拟合一个感受野模型,尝试恢复最初用于生成这些数据的原始线性滤波器。
# Authors: Chris Holdgraf <choldgraf@gmail.com>
#          Eric Larson <larson.eric.d@gmail.com>
#
# License: BSD-3-Clause
# Copyright the MNE-Python contributors.
import matplotlib.pyplot as plt
import numpy as np
from scipy.io import loadmat
from scipy.stats import multivariate_normal
from sklearn.preprocessing import scale

import mne
from mne.decoding import ReceptiveField, TimeDelayingRidge

rng = np.random.default_rng(1337)  # To make this example reproducible
加载音频数据#
我们将读取来自 [ 1 ] 的音频数据,以模拟响应。
此外,我们将沿时间维度对数据降采样,以加快计算速度。请注意,根据输入值的不同,这样做可能并不合适。例如,当输入刺激的变化速度比降采样后采样率的一半还快时。
# Read in audio that's been recorded in epochs.
path_audio = mne.datasets.mtrf.data_path()
data = loadmat(str(path_audio / "speech_data.mat"))
audio = data["spectrogram"].T
sfreq = float(data["Fs"][0, 0])
n_decim = 2
audio = mne.filter.resample(audio, down=n_decim, npad="auto")
sfreq /= n_decim
创建感受野#
我们将为一个理论上的神经信号模拟线性感受野。它定义了该信号如何对感受野空间中的功率作出响应。
n_freqs = 20
tmin, tmax = -0.1, 0.4

# To simulate the data we'll create explicit delays here
delays_samp = np.arange(np.round(tmin * sfreq), np.round(tmax * sfreq) + 1).astype(int)
delays_sec = delays_samp / sfreq
freqs = np.linspace(50, 5000, n_freqs)
grid = np.array(np.meshgrid(delays_sec, freqs))

# We need data to be shaped as n_epochs, n_features, n_times, so swap axes here
grid = grid.swapaxes(0, -1).swapaxes(0, 1)

# Simulate a temporal receptive field with a Gabor filter
means_high = [0.1, 500]
means_low = [0.2, 2500]
cov = [[0.001, 0], [0, 500000]]
gauss_high = multivariate_normal.pdf(grid, means_high, cov)
gauss_low = -1 * multivariate_normal.pdf(grid, means_low, cov)
weights = gauss_high + gauss_low  # Combine to create the "true" STRF
kwargs = dict(
    vmax=np.abs(weights).max(),
    vmin=-np.abs(weights).max(),
    cmap="RdBu_r",
    shading="gouraud",
)

fig, ax = plt.subplots(layout="constrained")
ax.pcolormesh(delays_sec, freqs, weights, **kwargs)
ax.set(title="Simulated STRF", xlabel="Time Lags (s)", ylabel="Frequency (Hz)")
plt.setp(ax.get_xticklabels(), rotation=45)
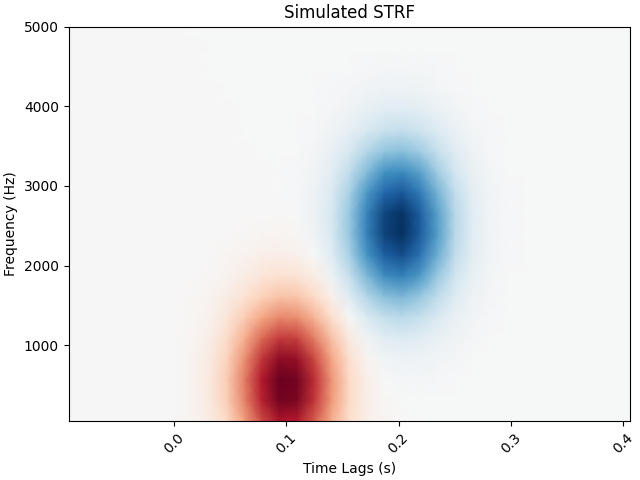
模拟神经响应#
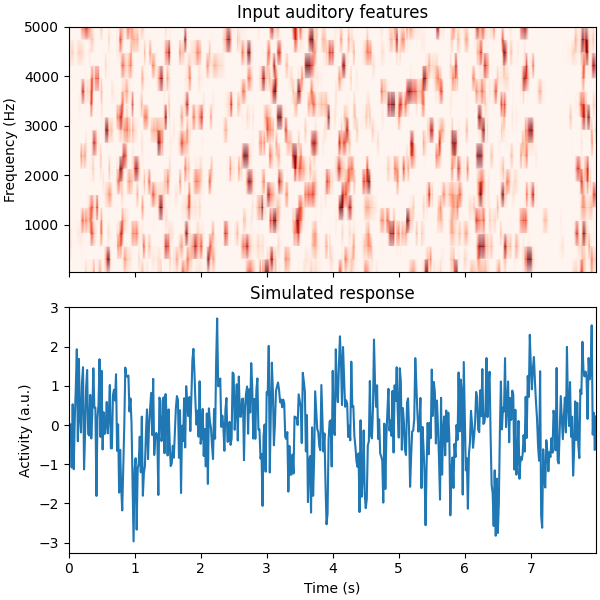
利用这个感受野,我们将生成对刺激的人工神经响应。
为此,我们会创建感受野的时间延迟版本,然后计算它与刺激之间的点积。请注意,这实际上是在刺激与感受野之间进行卷积。更多信息请参见此处。
# Reshape audio to split into epochs, then make epochs the first dimension.
n_epochs, n_seconds = 16, 5
audio = audio[:, : int(n_seconds * sfreq * n_epochs)]
X = audio.reshape([n_freqs, n_epochs, -1]).swapaxes(0, 1)
n_times = X.shape[-1]

# Delay the spectrogram according to delays so it can be combined w/ the STRF
# Lags will now be in axis 1, then we reshape to vectorize
delays = np.arange(np.round(tmin * sfreq), np.round(tmax * sfreq) + 1).astype(int)

# Iterate through indices and append
X_del = np.zeros((len(delays),) + X.shape)
for ii, ix_delay in enumerate(delays):
    # These arrays will take/put particular indices in the data
    take = [slice(None)] * X.ndim
    put = [slice(None)] * X.ndim
    if ix_delay > 0:
        take[-1] = slice(None, -ix_delay)
        put[-1] = slice(ix_delay, None)
    elif ix_delay < 0:
        take[-1] = slice(-ix_delay, None)
        put[-1] = slice(None, ix_delay)
    X_del[ii][tuple(put)] = X[tuple(take)]

# Now set the delayed axis to the 2nd dimension
X_del = np.rollaxis(X_del, 0, 3)
X_del = X_del.reshape([n_epochs, -1, n_times])
n_features = X_del.shape[1]
weights_sim = weights.ravel()

# Simulate a neural response to the sound, given this STRF
y = np.zeros((n_epochs, n_times))
for ii, iep in enumerate(X_del):
    # Simulate this epoch and add random noise
    noise_amp = 0.002
    y[ii] = np.dot(weights_sim, iep) + rng.normal(scale=noise_amp, size=n_times)

# Plot the first 2 trials of audio and the simulated electrode activity
X_plt = scale(np.hstack(X[:2]).T).T
y_plt = scale(np.hstack(y[:2]))
time = np.arange(X_plt.shape[-1]) / sfreq
_, (ax1, ax2) = plt.subplots(2, 1, figsize=(6, 6), sharex=True, layout="constrained")
ax1.pcolormesh(time, freqs, X_plt, vmin=0, vmax=4, cmap="Reds", shading="gouraud")
ax1.set_title("Input auditory features")
ax1.set(ylim=[freqs.min(), freqs.max()], ylabel="Frequency (Hz)")
ax2.plot(time, y_plt)
ax2.set(
    xlim=[time.min(), time.max()],
    title="Simulated response",
    xlabel="Time (s)",
    ylabel="Activity (a.u.)",
)
拟合模型以恢复该感受野#
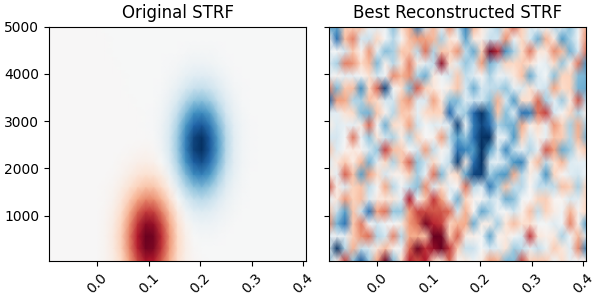
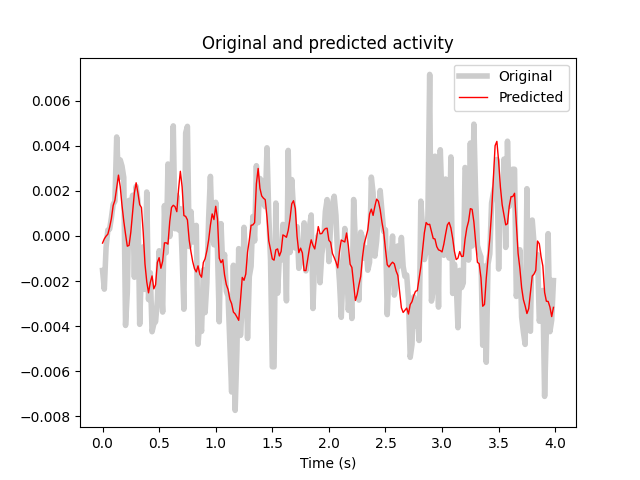
最后,我们将使用 mne.decoding.ReceptiveField 类来恢复该信号的线性感受野。请注意,感受野的性质(例如平滑度)取决于输入与输出的自相关。
# Create training and testing data
train, test = np.arange(n_epochs - 1), n_epochs - 1
X_train, X_test, y_train, y_test = X[train], X[test], y[train], y[test]
X_train, X_test, y_train, y_test = (
    np.rollaxis(ii, -1, 0) for ii in (X_train, X_test, y_train, y_test)
)
# Model the simulated data as a function of the spectrogram input
alphas = np.logspace(-3, 3, 7)
scores = np.zeros_like(alphas)
models = []
for ii, alpha in enumerate(alphas):
    rf = ReceptiveField(tmin, tmax, sfreq, freqs, estimator=alpha)
    rf.fit(X_train, y_train)

    # Now make predictions about the model output, given input stimuli.
    scores[ii] = rf.score(X_test, y_test).item()
    models.append(rf)

times = rf.delays_ / float(rf.sfreq)

# Choose the model that performed best on the held out data
ix_best_alpha = np.argmax(scores)
best_mod = models[ix_best_alpha]
coefs = best_mod.coef_[0]
best_pred = best_mod.predict(X_test)[:, 0]

# Plot the original STRF, and the one that we recovered with modeling.
_, (ax1, ax2) = plt.subplots(
    1,
    2,
    figsize=(6, 3),
    sharey=True,
    sharex=True,
    layout="constrained",
)
ax1.pcolormesh(delays_sec, freqs, weights, **kwargs)
ax2.pcolormesh(times, rf.feature_names, coefs, **kwargs)
ax1.set_title("Original STRF")
ax2.set_title("Best Reconstructed STRF")
plt.setp([iax.get_xticklabels() for iax in [ax1, ax2]], rotation=45)

# Plot the actual response and the predicted response on a held out stimulus
time_pred = np.arange(best_pred.shape[0]) / sfreq
fig, ax = plt.subplots()
ax.plot(time_pred, y_test, color="k", alpha=0.2, lw=4)
ax.plot(time_pred, best_pred, color="r", lw=1)
ax.set(title="Original and predicted activity", xlabel="Time (s)")
ax.legend(["Original", "Predicted"])
Fitting 15 epochs, 20 channels

  0%|          | Sample : 0/3450 [00:00<?,       ?it/s]
  0%|          | Sample : 1/3450 [00:04<4:37:51,    4.83s/it]
 28%|██▊       | Sample : 978/3450 [00:04<00:11,  212.23it/s]
 58%|█████▊    | Sample : 1991/3450 [00:04<00:03,  442.02it/s]
 87%|████████▋ | Sample : 3007/3450 [00:04<00:00,  682.82it/s]Fitting 15 epochs, 20 channels


  0%|          | Sample : 0/3450 [00:00<?,       ?it/s]

 29%|██▉       | Sample : 1003/3450 [00:00<00:00, 62679.90it/s]

 58%|█████▊    | Sample : 2011/3450 [00:00<00:00, 62833.90it/s]

 88%|████████▊ | Sample : 3020/3450 [00:00<00:00, 62913.32it/s]
100%|██████████| Sample : 3450/3450 [00:00<00:00, 62800.43it/s]
Fitting 15 epochs, 20 channels


  0%|          | Sample : 0/3450 [00:00<?,       ?it/s]

 29%|██▉       | Sample : 992/3450 [00:00<00:00, 61991.56it/s]

 58%|█████▊    | Sample : 1992/3450 [00:00<00:00, 62251.74it/s]

 87%|████████▋ | Sample : 3004/3450 [00:00<00:00, 62581.04it/s]
100%|██████████| Sample : 3450/3450 [00:00<00:00, 62523.92it/s]
Fitting 15 epochs, 20 channels


  0%|          | Sample : 0/3450 [00:00<?,       ?it/s]

 29%|██▉       | Sample : 1002/3450 [00:00<00:00, 62617.41it/s]

 59%|█████▊    | Sample : 2019/3450 [00:00<00:00, 63082.70it/s]

 88%|████████▊ | Sample : 3036/3450 [00:00<00:00, 63235.62it/s]
100%|██████████| Sample : 3450/3450 [00:00<00:00, 63171.92it/s]
Fitting 15 epochs, 20 channels


  0%|          | Sample : 0/3450 [00:00<?,       ?it/s]

 29%|██▉       | Sample : 1003/3450 [00:00<00:00, 62631.38it/s]

 59%|█████▊    | Sample : 2022/3450 [00:00<00:00, 63153.38it/s]

 88%|████████▊ | Sample : 3049/3450 [00:00<00:00, 63494.47it/s]
100%|██████████| Sample : 3450/3450 [00:00<00:00, 63500.14it/s]
Fitting 15 epochs, 20 channels


  0%|          | Sample : 0/3450 [00:00<?,       ?it/s]

 29%|██▉       | Sample : 1004/3450 [00:00<00:00, 62703.16it/s]

 59%|█████▊    | Sample : 2020/3450 [00:00<00:00, 63095.19it/s]

 88%|████████▊ | Sample : 3043/3450 [00:00<00:00, 63380.72it/s]
100%|██████████| Sample : 3450/3450 [00:00<00:00, 63352.80it/s]
Fitting 15 epochs, 20 channels


  0%|          | Sample : 0/3450 [00:00<?,       ?it/s]

 29%|██▉       | Sample : 1013/3450 [00:00<00:00, 63293.51it/s]

 59%|█████▉    | Sample : 2045/3450 [00:00<00:00, 63901.32it/s]

 89%|████████▉ | Sample : 3073/3450 [00:00<00:00, 64002.43it/s]
100%|██████████| Sample : 3450/3450 [00:00<00:00, 63900.57it/s]
可视化正则化的效果#
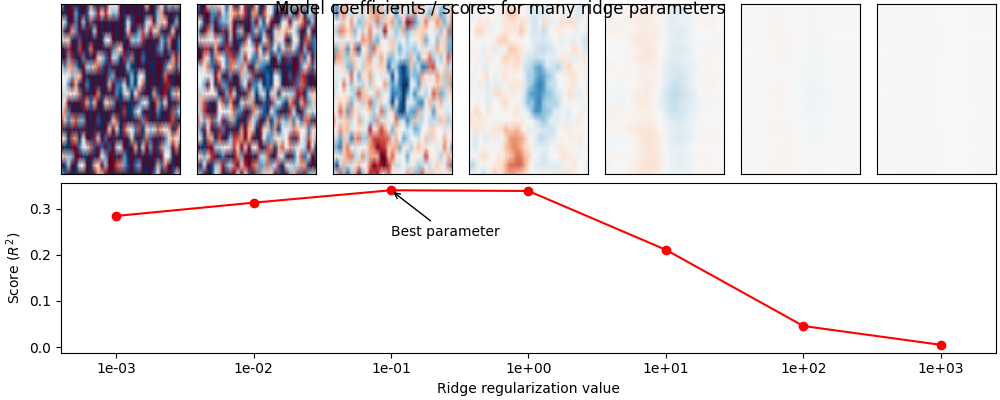
上面我们针对岭正则化参数的众多取值之一,拟合了一个 mne.decoding.ReceptiveField 模型。这里我们将绘制每个取值下的模型得分以及模型系数,以可视化系数如何随正则化程度变化。上述问题以及 STRF 流程在 [ 2 ] [ 3 ] [ 4 ] 中有详细描述。
# Plot model score for each ridge parameter
fig = plt.figure(figsize=(10, 4), layout="constrained")
ax = plt.subplot2grid([2, len(alphas)], [1, 0], 1, len(alphas))
ax.plot(np.arange(len(alphas)), scores, marker="o", color="r")
ax.annotate(
    "Best parameter",
    (ix_best_alpha, scores[ix_best_alpha]),
    (ix_best_alpha, scores[ix_best_alpha] - 0.1),
    arrowprops={"arrowstyle": "->"},
)
plt.xticks(np.arange(len(alphas)), [f"{ii:.0e}" for ii in alphas])
ax.set(
    xlabel="Ridge regularization value",
    ylabel="Score ($R^2$)",
    xlim=[-0.4, len(alphas) - 0.6],
)

# Plot the STRF of each ridge parameter
for ii, (rf, i_alpha) in enumerate(zip(models, alphas)):
    ax = plt.subplot2grid([2, len(alphas)], [0, ii], 1, 1)
    ax.pcolormesh(times, rf.feature_names, rf.coef_[0], **kwargs)
    plt.xticks([], [])
    plt.yticks([], [])
fig.suptitle("Model coefficients / scores for many ridge parameters", y=1)
使用不同的正则化类型#
除了标准的岭正则化外,mne.decoding.TimeDelayingRidge 类还提供拉普拉斯正则化项,形式为:
它对相邻的时间采样点和/或特征施加平滑性约束。引用 [ 1 ] 的说法:
Tikhonov [单位] 正则化(公式 5)通过对 TRF 估计进行平滑来减少过拟合,且这种平滑对感兴趣信号的幅度不敏感。然而,拉普拉斯方法(公式 6)在保留信号幅度的同时降低样本外误差(Lalor et al., 2006)。因此,与 Tikhonov 正则化相比,该方法通常能更好地估计系统响应(以 MSE 衡量)。
scores_lap = np.zeros_like(alphas)
models_lap = []
for ii, alpha in enumerate(alphas):
    estimator = TimeDelayingRidge(tmin, tmax, sfreq, reg_type="laplacian", alpha=alpha)
    rf = ReceptiveField(tmin, tmax, sfreq, freqs, estimator=estimator)
    rf.fit(X_train, y_train)

    # Now make predictions about the model output, given input stimuli.
    scores_lap[ii] = rf.score(X_test, y_test).item()
    models_lap.append(rf)

ix_best_alpha_lap = np.argmax(scores_lap)
Fitting 15 epochs, 20 channels


  0%|          | Sample : 0/3450 [00:00<?,       ?it/s]

 30%|██▉       | Sample : 1029/3450 [00:00<00:00, 64255.88it/s]

 60%|█████▉    | Sample : 2069/3450 [00:00<00:00, 64628.86it/s]

 90%|█████████ | Sample : 3107/3450 [00:00<00:00, 64704.26it/s]
100%|██████████| Sample : 3450/3450 [00:00<00:00, 64672.82it/s]
Fitting 15 epochs, 20 channels


  0%|          | Sample : 0/3450 [00:00<?,       ?it/s]

 30%|███       | Sample : 1036/3450 [00:00<00:00, 64720.94it/s]

 60%|██████    | Sample : 2080/3450 [00:00<00:00, 64967.31it/s]

 91%|█████████ | Sample : 3124/3450 [00:00<00:00, 65049.00it/s]
100%|██████████| Sample : 3450/3450 [00:00<00:00, 64962.58it/s]
Fitting 15 epochs, 20 channels


  0%|          | Sample : 0/3450 [00:00<?,       ?it/s]

 30%|███       | Sample : 1040/3450 [00:00<00:00, 64965.99it/s]

 60%|██████    | Sample : 2086/3450 [00:00<00:00, 65152.22it/s]

 91%|█████████ | Sample : 3136/3450 [00:00<00:00, 65312.39it/s]
100%|██████████| Sample : 3450/3450 [00:00<00:00, 65245.82it/s]
Fitting 15 epochs, 20 channels


  0%|          | Sample : 0/3450 [00:00<?,       ?it/s]

 30%|███       | Sample : 1043/3450 [00:00<00:00, 65137.87it/s]

 61%|██████    | Sample : 2095/3450 [00:00<00:00, 65447.10it/s]

 91%|█████████ | Sample : 3146/3450 [00:00<00:00, 65515.57it/s]
100%|██████████| Sample : 3450/3450 [00:00<00:00, 65430.80it/s]
Fitting 15 epochs, 20 channels


  0%|          | Sample : 0/3450 [00:00<?,       ?it/s]

 30%|██▉       | Sample : 1030/3450 [00:00<00:00, 64326.94it/s]

 60%|██████    | Sample : 2081/3450 [00:00<00:00, 64992.57it/s]

 91%|█████████ | Sample : 3126/3450 [00:00<00:00, 65098.16it/s]
100%|██████████| Sample : 3450/3450 [00:00<00:00, 65014.82it/s]
Fitting 15 epochs, 20 channels


  0%|          | Sample : 0/3450 [00:00<?,       ?it/s]

 30%|██▉       | Sample : 1034/3450 [00:00<00:00, 64580.60it/s]

 60%|██████    | Sample : 2080/3450 [00:00<00:00, 64986.79it/s]

 91%|█████████ | Sample : 3125/3450 [00:00<00:00, 65083.23it/s]
100%|██████████| Sample : 3450/3450 [00:00<00:00, 64673.68it/s]
Fitting 15 epochs, 20 channels


  0%|          | Sample : 0/3450 [00:00<?,       ?it/s]

 30%|███       | Sample : 1038/3450 [00:00<00:00, 64838.15it/s]

 60%|██████    | Sample : 2087/3450 [00:00<00:00, 65202.47it/s]

 91%|█████████ | Sample : 3135/3450 [00:00<00:00, 65302.27it/s]
100%|██████████| Sample : 3450/3450 [00:00<00:00, 65230.82it/s]
比较模型性能#
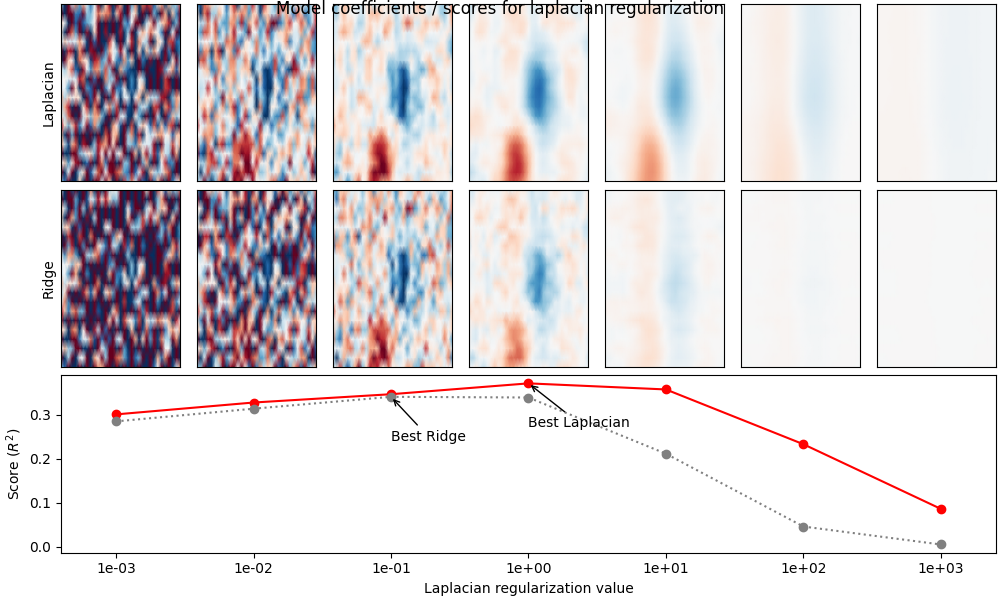
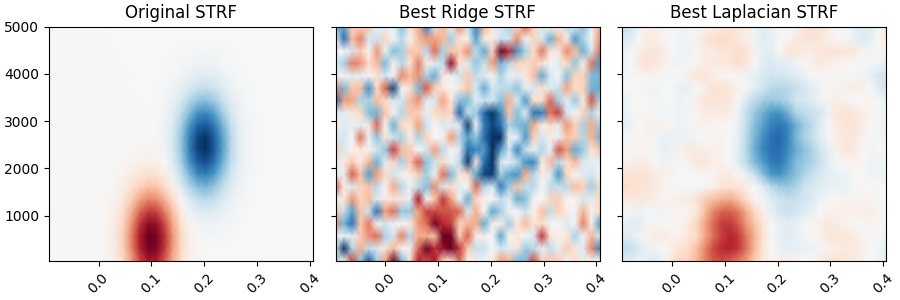
下面我们可视化每种正则化方法(岭回归与拉普拉斯)在不同 alpha 水平下的模型性能。可以看到,拉普拉斯方法通常表现更好,因为它沿系数的维度和特征维度施加平滑性约束。这与“真实”的感受野结构相符,从而获得更好的模型拟合。
fig = plt.figure(figsize=(10, 6), layout="constrained")
ax = plt.subplot2grid([3, len(alphas)], [2, 0], 1, len(alphas))
ax.plot(np.arange(len(alphas)), scores_lap, marker="o", color="r")
ax.plot(np.arange(len(alphas)), scores, marker="o", color="0.5", ls=":")
ax.annotate(
    "Best Laplacian",
    (ix_best_alpha_lap, scores_lap[ix_best_alpha_lap]),
    (ix_best_alpha_lap, scores_lap[ix_best_alpha_lap] - 0.1),
    arrowprops={"arrowstyle": "->"},
)
ax.annotate(
    "Best Ridge",
    (ix_best_alpha, scores[ix_best_alpha]),
    (ix_best_alpha, scores[ix_best_alpha] - 0.1),
    arrowprops={"arrowstyle": "->"},
)
plt.xticks(np.arange(len(alphas)), [f"{ii:.0e}" for ii in alphas])
ax.set(
    xlabel="Laplacian regularization value",
    ylabel="Score ($R^2$)",
    xlim=[-0.4, len(alphas) - 0.6],
)

# Plot the STRF of each ridge parameter
xlim = times[[0, -1]]
for ii, (rf_lap, rf, i_alpha) in enumerate(zip(models_lap, models, alphas)):
    ax = plt.subplot2grid([3, len(alphas)], [0, ii], 1, 1)
    ax.pcolormesh(times, rf_lap.feature_names, rf_lap.coef_[0], **kwargs)
    ax.set(xticks=[], yticks=[], xlim=xlim)
    if ii == 0:
        ax.set(ylabel="Laplacian")
    ax = plt.subplot2grid([3, len(alphas)], [1, ii], 1, 1)
    ax.pcolormesh(times, rf.feature_names, rf.coef_[0], **kwargs)
    ax.set(xticks=[], yticks=[], xlim=xlim)
    if ii == 0:
        ax.set(ylabel="Ridge")
fig.suptitle("Model coefficients / scores for laplacian regularization", y=1)
绘制原始 STRF,以及我们通过建模恢复出的 STRF。
rf = models[ix_best_alpha]
rf_lap = models_lap[ix_best_alpha_lap]
_, (ax1, ax2, ax3) = plt.subplots(
    1,
    3,
    figsize=(9, 3),
    sharey=True,
    sharex=True,
    layout="constrained",
)
ax1.pcolormesh(delays_sec, freqs, weights, **kwargs)
ax2.pcolormesh(times, rf.feature_names, rf.coef_[0], **kwargs)
ax3.pcolormesh(times, rf_lap.feature_names, rf_lap.coef_[0], **kwargs)
ax1.set_title("Original STRF")
ax2.set_title("Best Ridge STRF")
ax3.set_title("Best Laplacian STRF")
plt.setp([iax.get_xticklabels() for iax in [ax1, ax2, ax3]], rotation=45)
参考文献#
脚本总运行时间:(0 分钟 10.321 秒)