
说明
转到末尾下载完整示例代码。
基于多导睡眠图(PSG)数据的睡眠分期#
说明
本代码取自 [ 1 ] 中使用的分析代码。如果您复用此代码,请考虑引用该工作。
本教程说明如何执行一个简易的多导睡眠图分析,以回答以下问题:
该问题作为有监督多分类任务来处理。目标是对每 30 秒的数据片段,从 5 种可能的阶段中预测睡眠阶段。
# Authors: Alexandre Gramfort <alexandre.gramfort@inria.fr>
#          Stanislas Chambon <stan.chambon@gmail.com>
#          Joan Massich <mailsik@gmail.com>
#
# License: BSD-3-Clause
# Copyright the MNE-Python contributors.
import matplotlib.pyplot as plt
import numpy as np
from sklearn.ensemble import RandomForestClassifier
from sklearn.metrics import accuracy_score, classification_report, confusion_matrix
from sklearn.pipeline import make_pipeline
from sklearn.preprocessing import FunctionTransformer

import mne
from mne.datasets.sleep_physionet.age import fetch_data
加载数据#
这里我们下载两名受试者的数据。最终目标是获得 epoch 及相应的真实标签。
MNE-Python 提供了 mne.datasets.sleep_physionet.age.fetch_data(),可方便地从 Sleep Physionet 数据集 [ 2 ] [ 3 ] 下载数据。给定受试者和记录列表,该获取函数会下载数据,并为每个受试者提供一对文件:
-
PSG.edf,包含多导睡眠图,即来自 EEG 头戴设备的原始数据;-
Hypnogram.edf,包含由专家记录的注释。
将这两者合并到 mne.io.Raw 对象中,我们就可以根据注释的描述提取事件,从而获得 epochs。
读取 PSG 数据与睡眠图(Hypnogram)以创建 raw 对象#
ALICE, BOB = 0, 1

[alice_files, bob_files] = fetch_data(subjects=[ALICE, BOB], recording=[1])

raw_train = mne.io.read_raw_edf(
    alice_files[0],
    stim_channel="Event marker",
    infer_types=True,
    preload=True,
    verbose="error",  # ignore issues with stored filter settings
)
annot_train = mne.read_annotations(alice_files[1])

raw_train.set_annotations(annot_train, emit_warning=False)

# plot some data
# scalings were chosen manually to allow for simultaneous visualization of
# different channel types in this specific dataset
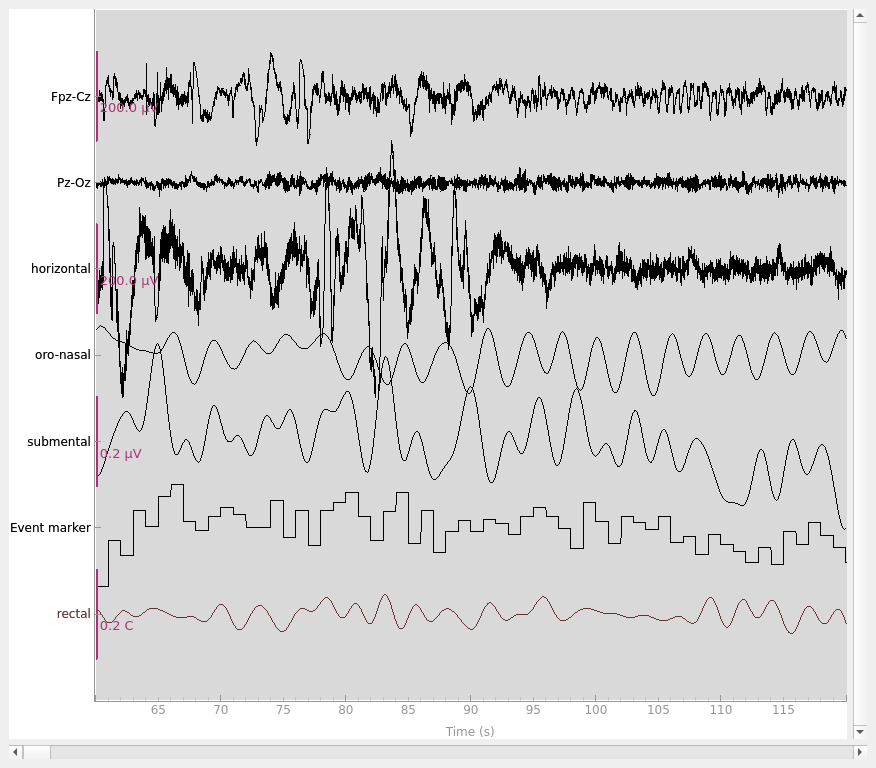
raw_train.plot(
    start=60,
    duration=60,
    scalings=dict(eeg=1e-4, resp=1e3, eog=1e-4, emg=1e-7, misc=1e-1),
)
Using default location ~/mne_data for PHYSIONET_SLEEP...
Using qt as 2D backend.
从注释中提取 30 秒事件#
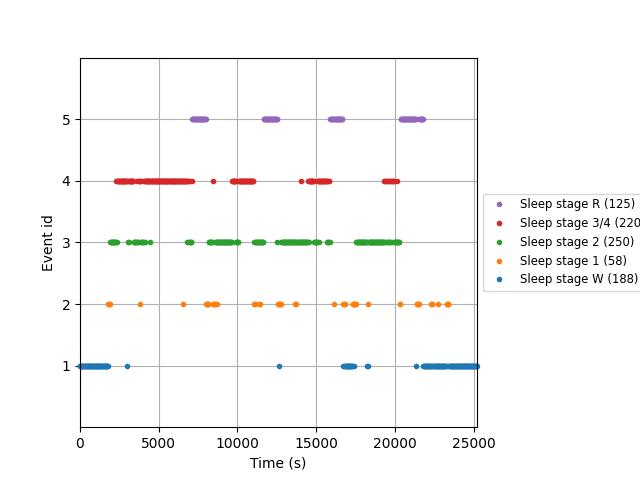
Sleep Physionet 数据集使用 8 个标签进行注释:Wake (W)、Stage 1、Stage 2、Stage 3、Stage 4(对应从浅睡到深睡的范围)、REM 睡眠 (R)(REM 是 Rapid Eye Movement sleep,即快速眼动睡眠的缩写)、movement (M),以及用于任何未评分片段的 Stage (?) 。
我们只使用 5 个阶段:Wake (W)、Stage 1、Stage 2、Stage 3/4 和 REM 睡眠 (R)。为此,我们使用 mne.events_from_annotations() 中的 event_id 参数来选择感兴趣的事件,并为每个事件关联一个事件标识符。
此外,每段记录在夜晚睡眠前后都包含较长的清醒 (W) 区段。为减轻类别不平衡的影响,我们对每段记录进行裁剪,仅保留第一个睡眠阶段出现前 30 分钟和最后一个睡眠阶段结束后 30 分钟的清醒时间。
annotation_desc_2_event_id = {
    "Sleep stage W": 1,
    "Sleep stage 1": 2,
    "Sleep stage 2": 3,
    "Sleep stage 3": 4,
    "Sleep stage 4": 4,
    "Sleep stage R": 5,
}

# keep last 30-min wake events before sleep and first 30-min wake events after
# sleep and redefine annotations on raw data
annot_train.crop(annot_train[1]["onset"] - 30 * 60, annot_train[-2]["onset"] + 30 * 60)
raw_train.set_annotations(annot_train, emit_warning=False)

events_train, _ = mne.events_from_annotations(
    raw_train, event_id=annotation_desc_2_event_id, chunk_duration=30.0
)

# create a new event_id that unifies stages 3 and 4
event_id = {
    "Sleep stage W": 1,
    "Sleep stage 1": 2,
    "Sleep stage 2": 3,
    "Sleep stage 3/4": 4,
    "Sleep stage R": 5,
}

# plot events
fig = mne.viz.plot_events(
    events_train,
    event_id=event_id,
    sfreq=raw_train.info["sfreq"],
    first_samp=events_train[0, 0],
)

# keep the color-code for further plotting
stage_colors = plt.rcParams["axes.prop_cycle"].by_key()["color"]
Used Annotations descriptions: ['Sleep stage 1', 'Sleep stage 2', 'Sleep stage 3', 'Sleep stage 4', 'Sleep stage R', 'Sleep stage W']
根据注释中找到的事件从数据创建 Epochs#
tmax = 30.0 - 1.0 / raw_train.info["sfreq"]  # tmax in included

epochs_train = mne.Epochs(
    raw=raw_train,
    events=events_train,
    event_id=event_id,
    tmin=0.0,
    tmax=tmax,
    baseline=None,
)
del raw_train

print(epochs_train)
Not setting metadata
841 matching events found
No baseline correction applied
0 projection items activated
<Epochs | 841 events (good & bad), 0 – 29.99 s (baseline off), ~10 KiB, data not loaded,
 'Sleep stage W': 188
 'Sleep stage 1': 58
 'Sleep stage 2': 250
 'Sleep stage 3/4': 220
 'Sleep stage R': 125>
对 Bob 的测试数据应用相同步骤#
raw_test = mne.io.read_raw_edf(
    bob_files[0],
    stim_channel="Event marker",
    infer_types=True,
    preload=True,
    verbose="error",
)
annot_test = mne.read_annotations(bob_files[1])
annot_test.crop(annot_test[1]["onset"] - 30 * 60, annot_test[-2]["onset"] + 30 * 60)
raw_test.set_annotations(annot_test, emit_warning=False)
events_test, _ = mne.events_from_annotations(
    raw_test, event_id=annotation_desc_2_event_id, chunk_duration=30.0
)
epochs_test = mne.Epochs(
    raw=raw_test,
    events=events_test,
    event_id=event_id,
    tmin=0.0,
    tmax=tmax,
    baseline=None,
)
del raw_test

print(epochs_test)
Used Annotations descriptions: ['Sleep stage 1', 'Sleep stage 2', 'Sleep stage 3', 'Sleep stage 4', 'Sleep stage R', 'Sleep stage W']
Not setting metadata
1103 matching events found
No baseline correction applied
0 projection items activated
<Epochs | 1103 events (good & bad), 0 – 29.99 s (baseline off), ~10 KiB, data not loaded,
 'Sleep stage W': 157
 'Sleep stage 1': 109
 'Sleep stage 2': 562
 'Sleep stage 3/4': 105
 'Sleep stage R': 170>
特征工程#
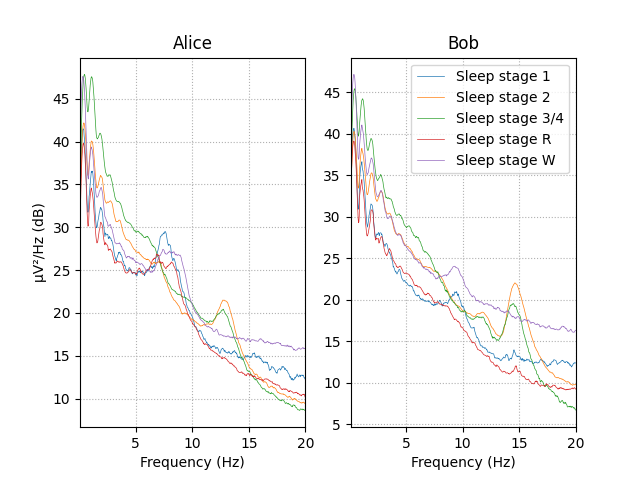
观察按睡眠阶段分组的 epoch 的功率谱密度(PSD)图,可以看到不同睡眠阶段具有不同的特征模式。这些特征在 Alice 和 Bob 的数据之间保持相似。
在本节的其余部分,我们将基于特定频带的相对功率创建 EEG 特征,以捕捉数据中睡眠阶段之间的这种差异。
# visualize Alice vs. Bob PSD by sleep stage.
fig, (ax1, ax2) = plt.subplots(ncols=2)

# iterate over the subjects
stages = sorted(event_id.keys())
for ax, title, epochs in zip([ax1, ax2], ["Alice", "Bob"], [epochs_train, epochs_test]):
    for stage, color in zip(stages, stage_colors):
        spectrum = epochs[stage].compute_psd(fmin=0.1, fmax=20.0)
        spectrum.plot(
            ci=None,
            color=color,
            axes=ax,
            show=False,
            average=True,
            amplitude=False,
            spatial_colors=False,
            picks="data",
            exclude="bads",
        )
    ax.set(title=title, xlabel="Frequency (Hz)")
ax1.set(ylabel="µV²/Hz (dB)")
ax2.legend(ax2.lines[2::3], stages)
Using data from preloaded Raw for 58 events and 3000 original time points ...
0 bad epochs dropped
    Using multitaper spectrum estimation with 7 DPSS windows
Plotting power spectral density (dB=True).
Averaging across epochs before plotting...
Using data from preloaded Raw for 250 events and 3000 original time points ...
0 bad epochs dropped
    Using multitaper spectrum estimation with 7 DPSS windows
Plotting power spectral density (dB=True).
Averaging across epochs before plotting...
Using data from preloaded Raw for 220 events and 3000 original time points ...
0 bad epochs dropped
    Using multitaper spectrum estimation with 7 DPSS windows
Plotting power spectral density (dB=True).
Averaging across epochs before plotting...
Using data from preloaded Raw for 125 events and 3000 original time points ...
0 bad epochs dropped
    Using multitaper spectrum estimation with 7 DPSS windows
Plotting power spectral density (dB=True).
Averaging across epochs before plotting...
Using data from preloaded Raw for 188 events and 3000 original time points ...
0 bad epochs dropped
    Using multitaper spectrum estimation with 7 DPSS windows
Plotting power spectral density (dB=True).
Averaging across epochs before plotting...
Using data from preloaded Raw for 109 events and 3000 original time points ...
0 bad epochs dropped
    Using multitaper spectrum estimation with 7 DPSS windows
Plotting power spectral density (dB=True).
Averaging across epochs before plotting...
Using data from preloaded Raw for 562 events and 3000 original time points ...
0 bad epochs dropped
    Using multitaper spectrum estimation with 7 DPSS windows
Plotting power spectral density (dB=True).
Averaging across epochs before plotting...
Using data from preloaded Raw for 105 events and 3000 original time points ...
0 bad epochs dropped
    Using multitaper spectrum estimation with 7 DPSS windows
Plotting power spectral density (dB=True).
Averaging across epochs before plotting...
Using data from preloaded Raw for 170 events and 3000 original time points ...
0 bad epochs dropped
    Using multitaper spectrum estimation with 7 DPSS windows
Plotting power spectral density (dB=True).
Averaging across epochs before plotting...
Using data from preloaded Raw for 157 events and 3000 original time points ...
0 bad epochs dropped
    Using multitaper spectrum estimation with 7 DPSS windows
Plotting power spectral density (dB=True).
Averaging across epochs before plotting...
用 Python 函数设计 scikit-learn 变换器#
现在我们将创建一个函数,基于特定频带的相对功率提取 EEG 特征,以便从 EEG 信号预测睡眠阶段。
def eeg_power_band(epochs):
    """EEG relative power band feature extraction.

    This function takes an ``mne.Epochs`` object and creates EEG features based
    on relative power in specific frequency bands that are compatible with
    scikit-learn.

    Parameters
    ----------
    epochs : Epochs
        The data.

    Returns
    -------
    X : numpy array of shape [n_samples, 5 * n_channels]
        Transformed data.
    """
    # specific frequency bands
    FREQ_BANDS = {
        "delta": [0.5, 4.5],
        "theta": [4.5, 8.5],
        "alpha": [8.5, 11.5],
        "sigma": [11.5, 15.5],
        "beta": [15.5, 30],
    }

    spectrum = epochs.compute_psd(picks="eeg", fmin=0.5, fmax=30.0)
    psds, freqs = spectrum.get_data(return_freqs=True)
    # Normalize the PSDs
    psds /= np.sum(psds, axis=-1, keepdims=True)

    X = []
    for fmin, fmax in FREQ_BANDS.values():
        psds_band = psds[:, :, (freqs >= fmin) & (freqs < fmax)].mean(axis=-1)
        X.append(psds_band.reshape(len(psds), -1))

    return np.concatenate(X, axis=1)
使用 scikit-learn 的多分类工作流#
为了回答“能在多大程度上利用 Alice 的数据预测 Bob 的睡眠阶段”这一问题,并尽量避免样板代码,我们将利用 scikit-learn 的两个关键特性:Pipeline 和 FunctionTransformer。
scikit-learn 的 pipeline 将一个估计器组合为一系列变换和一个最终估计器,而 FunctionTransformer 可将 Python 函数转换为与估计器兼容的对象。这样,借助我们刚创建的 eeg_power_band 函数,就能创建一个接受 mne.Epochs 的 scikit-learn 估计器。
pipe = make_pipeline(
    FunctionTransformer(eeg_power_band, validate=False),
    RandomForestClassifier(n_estimators=100, random_state=241),
)

# Train
y_train = epochs_train.events[:, 2]
pipe.fit(epochs_train, y_train)

# Test
y_pred = pipe.predict(epochs_test)

# Assess the results
y_test = epochs_test.events[:, 2]
acc = accuracy_score(y_test, y_pred)

print(f"Accuracy score: {acc}")
Using data from preloaded Raw for 841 events and 3000 original time points ...
0 bad epochs dropped
    Using multitaper spectrum estimation with 7 DPSS windows
Using data from preloaded Raw for 1103 events and 3000 original time points ...
0 bad epochs dropped
    Using multitaper spectrum estimation with 7 DPSS windows
Accuracy score: 0.6872166817769719
简而言之,可以。我们可以基于 Alice 的数据预测 Bob 的睡眠阶段。
数据的进一步分析#
我们可以查看混淆矩阵或分类报告。
print(confusion_matrix(y_test, y_pred))
[[152   0   1   4   0]
 [ 68  29   8   1   3]
 [ 44  30 447  23  18]
 [  0   0   4 101   0]
 [ 52  72  17   0  29]]
print(classification_report(y_test, y_pred, target_names=event_id.keys()))
                 precision    recall  f1-score   support

  Sleep stage W       0.48      0.97      0.64       157
  Sleep stage 1       0.22      0.27      0.24       109
  Sleep stage 2       0.94      0.80      0.86       562
Sleep stage 3/4       0.78      0.96      0.86       105
  Sleep stage R       0.58      0.17      0.26       170

       accuracy                           0.69      1103
      macro avg       0.60      0.63      0.57      1103
   weighted avg       0.73      0.69      0.68      1103
练习#
从 Physionet 数据库获取 50 名受试者,并运行 5 折交叉验证,每次将 10 名受试者留作测试集。
参考文献#
脚本总运行时间:(0 分钟 6.677 秒)