非官方中文翻译
本页译自 MNE-Python 官方文档:
查看英文原文 ↗。
文档版权归 MNE Developers 所有(BSD-3-Clause)。
说明
转到末尾下载完整示例代码。
传感器空间解码:跨时间与条件的泛化#
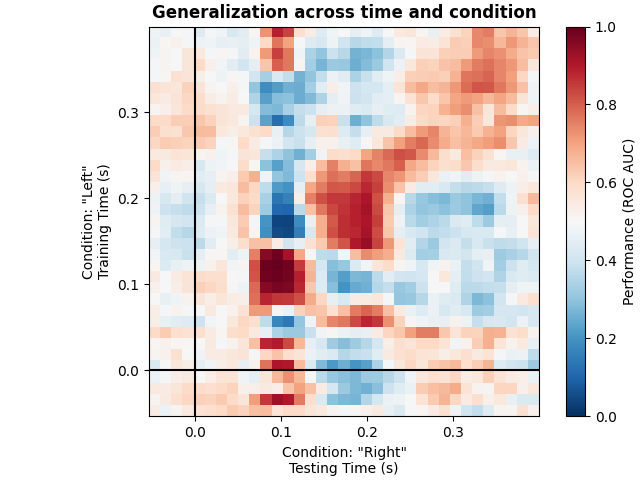
本示例运行 [1] 中描述的分析。它展示如何拟合一个线性分类器,在给定时点找出具有判别性的地形图,随后评估该线性模型能否准确预测另一组条件的所有时间采样点。
# Authors: Jean-Rémi King <jeanremi.king@gmail.com>
#          Alexandre Gramfort <alexandre.gramfort@inria.fr>
#          Denis Engemann <denis.engemann@gmail.com>
#
# License: BSD-3-Clause
# Copyright the MNE-Python contributors.
import matplotlib.pyplot as plt
from sklearn.linear_model import LogisticRegression
from sklearn.pipeline import make_pipeline
from sklearn.preprocessing import StandardScaler

import mne
from mne.datasets import sample
from mne.decoding import GeneralizingEstimator

# Preprocess data
data_path = sample.data_path()
# Load and filter data, set up epochs
meg_path = data_path / "MEG" / "sample"
raw_fname = meg_path / "sample_audvis_filt-0-40_raw.fif"
events_fname = meg_path / "sample_audvis_filt-0-40_raw-eve.fif"
raw = mne.io.read_raw_fif(raw_fname, preload=True)
picks = mne.pick_types(raw.info, meg=True, exclude="bads")  # Pick MEG channels
raw.filter(1.0, 30.0, fir_design="firwin")  # Band pass filtering signals
events = mne.read_events(events_fname)
event_id = {
    "Auditory/Left": 1,
    "Auditory/Right": 2,
    "Visual/Left": 3,
    "Visual/Right": 4,
}
tmin = -0.050
tmax = 0.400
# decimate to make the example faster to run, but then use verbose='error' in
# the Epochs constructor to suppress warning about decimation causing aliasing
decim = 2
epochs = mne.Epochs(
    raw,
    events,
    event_id=event_id,
    tmin=tmin,
    tmax=tmax,
    proj=True,
    picks=picks,
    baseline=None,
    preload=True,
    reject=dict(mag=5e-12),
    decim=decim,
    verbose="error",
)
Opening raw data file /home/circleci/mne_data/MNE-sample-data/MEG/sample/sample_audvis_filt-0-40_raw.fif...
    Read a total of 4 projection items:
        PCA-v1 (1 x 10²)  idle
        PCA-v2 (1 x 10²)  idle
        PCA-v3 (1 x 10²)  idle
        Average EEG reference (1 x 60)  idle
    Range : 6450 ... 48149 =     42.956 ...   320.665 secs
Ready.
Reading 0 ... 41699  =      0.000 ...   277.709 secs...
Filtering raw data in 1 contiguous segment
Setting up band-pass filter from 1 - 30 Hz

FIR filter parameters
---------------------
Designing a one-pass, zero-phase, non-causal bandpass filter:
- Windowed time-domain design (firwin) method
- Hamming window with 0.0194 passband ripple and 53 dB stopband attenuation
- Lower passband edge: 1.00
- Lower transition bandwidth: 1.00 Hz (-6 dB cutoff frequency: 0.50 Hz)
- Upper passband edge: 30.00 Hz
- Upper transition bandwidth: 7.50 Hz (-6 dB cutoff frequency: 33.75 Hz)
- Filter length: 497 samples (3.310 s)
我们在所有左侧视觉 vs 听觉试次上训练分类器,并在所有右侧视觉 vs 听觉试次上测试。
clf = make_pipeline(
    StandardScaler(),
    # liblinear is faster than lbfgs
    LogisticRegression(solver="liblinear", random_state=131),
)
time_gen = GeneralizingEstimator(clf, scoring="roc_auc", n_jobs=None, verbose=True)

# Fit classifiers on the epochs where the stimulus was presented to the left.
# Note that the experimental condition y indicates auditory or visual
time_gen.fit(X=epochs["Left"].get_data(copy=False), y=epochs["Left"].events[:, 2] > 2)
  0%|          | Fitting GeneralizingEstimator : 0/35 [00:00<?,       ?it/s]
 14%|█▍        | Fitting GeneralizingEstimator : 5/35 [00:00<00:00,  148.07it/s]
 34%|███▍      | Fitting GeneralizingEstimator : 12/35 [00:00<00:00,  178.62it/s]
 54%|█████▍    | Fitting GeneralizingEstimator : 19/35 [00:00<00:00,  189.09it/s]
 74%|███████▍  | Fitting GeneralizingEstimator : 26/35 [00:00<00:00,  194.33it/s]
 91%|█████████▏| Fitting GeneralizingEstimator : 32/35 [00:00<00:00,  190.94it/s]
100%|██████████| Fitting GeneralizingEstimator : 35/35 [00:00<00:00,  194.80it/s]
在刺激呈现在右侧的分段上计算得分。
scores = time_gen.score(
    X=epochs["Right"].get_data(copy=False), y=epochs["Right"].events[:, 2] > 2
)
0%|          | Scoring GeneralizingEstimator : 0/1225 [00:00<?,       ?it/s]
1%|          | Scoring GeneralizingEstimator : 11/1225 [00:00<00:03,  325.98it/s]
2%|▏         | Scoring GeneralizingEstimator : 23/1225 [00:00<00:03,  341.69it/s]
3%|▎         | Scoring GeneralizingEstimator : 35/1225 [00:00<00:03,  347.06it/s]
3%|▎         | Scoring GeneralizingEstimator : 35/1225 [00:00<00:03,  335.57it/s]
绘图
fig, ax = plt.subplots(layout="constrained")
im = ax.matshow(
    scores,
    vmin=0,
    vmax=1.0,
    cmap="RdBu_r",
    origin="lower",
    extent=epochs.times[[0, -1, 0, -1]],
)
ax.axhline(0.0, color="k")
ax.axvline(0.0, color="k")
ax.xaxis.set_ticks_position("bottom")
ax.set_xlabel(
    'Condition: "Right"\nTesting Time (s)',
)
ax.set_ylabel('Condition: "Left"\nTraining Time (s)')
ax.set_title("Generalization across time and condition", fontweight="bold")
fig.colorbar(im, ax=ax, label="Performance (ROC AUC)")
plt.show()